Understanding the Cost-Complexity Curves of Automating Online Behavior
We at IPM have been exploring the cost and complexity of generating different kinds of fake activity patterns on social media platforms. At its most basic, activity patterns are one of the easiest ways to identify and separate automated behavior in online spaces. In a data-centric world, almost every behavior users engage in online are logged at some level of an online system - and commonly, those logged behaviors are also timestamped. By aggregating timestamped activity, data engineers and researchers can quickly and robustly put together charts of traffic patterns across most use cases of their system, and easily separate automated behavior from “organic” behavior. As an example, this is particularly clear in work by Iacopo Pozzana and Emilio Ferrara, which shows that reliable patterns in inter-event time allows researchers to separate bots from typical users.

Approximated illustration of how different types of traffic can be engineered (dashed lines) as compared to observed real activity (solid line)
Understanding the cost-complexity curve of how people engineer bots to be robust against this type of detection is important because bad actors need to simulate traffic patterns sufficient to avoid detection by a platform. It is trivial to implement bots that work on uniform distributions (the purple line above) of traffic, but it is also trivial to identify instances of bots using that strategy. In lieu of a uniform distribution, an approximated “cyclical” distribution that attempts to mimic 24 hour activity cycles is slightly more complex and is in turn slightly harder to separate (orange). Fully simulated traffic is almost impossible to separate, in that it attempts to mimic almost identically the traffic pattern of actual users, but it requires lots of infrastructure to do successfully - very fine-grained details of minute-to-minute activity patterns, both at the level of individual actors as well as the overall environment, needs to be known if this is to be implemented - of course, it’s also extremely hard to detect (green). In short, as the complexity is raised for implementing systems capable of increasing mimicry, the cost of detecting the bad behavior is also raised. If the costs are linear: that's good news. By improving your detection processes, you can steadily impose greater costs on bad actors.

Linear Cost-Complexity curves for mimicking traffic behavior in online spaces
Different actors will face different cost-complexity curves, however. For example, labor could be very cheap relative to the value of certain goals: in some cases, bad actors could hire a team of trolls to manually run believable accounts in these situations. Improvements in filtering out fake traffic will impose only limited costs on bad actors.
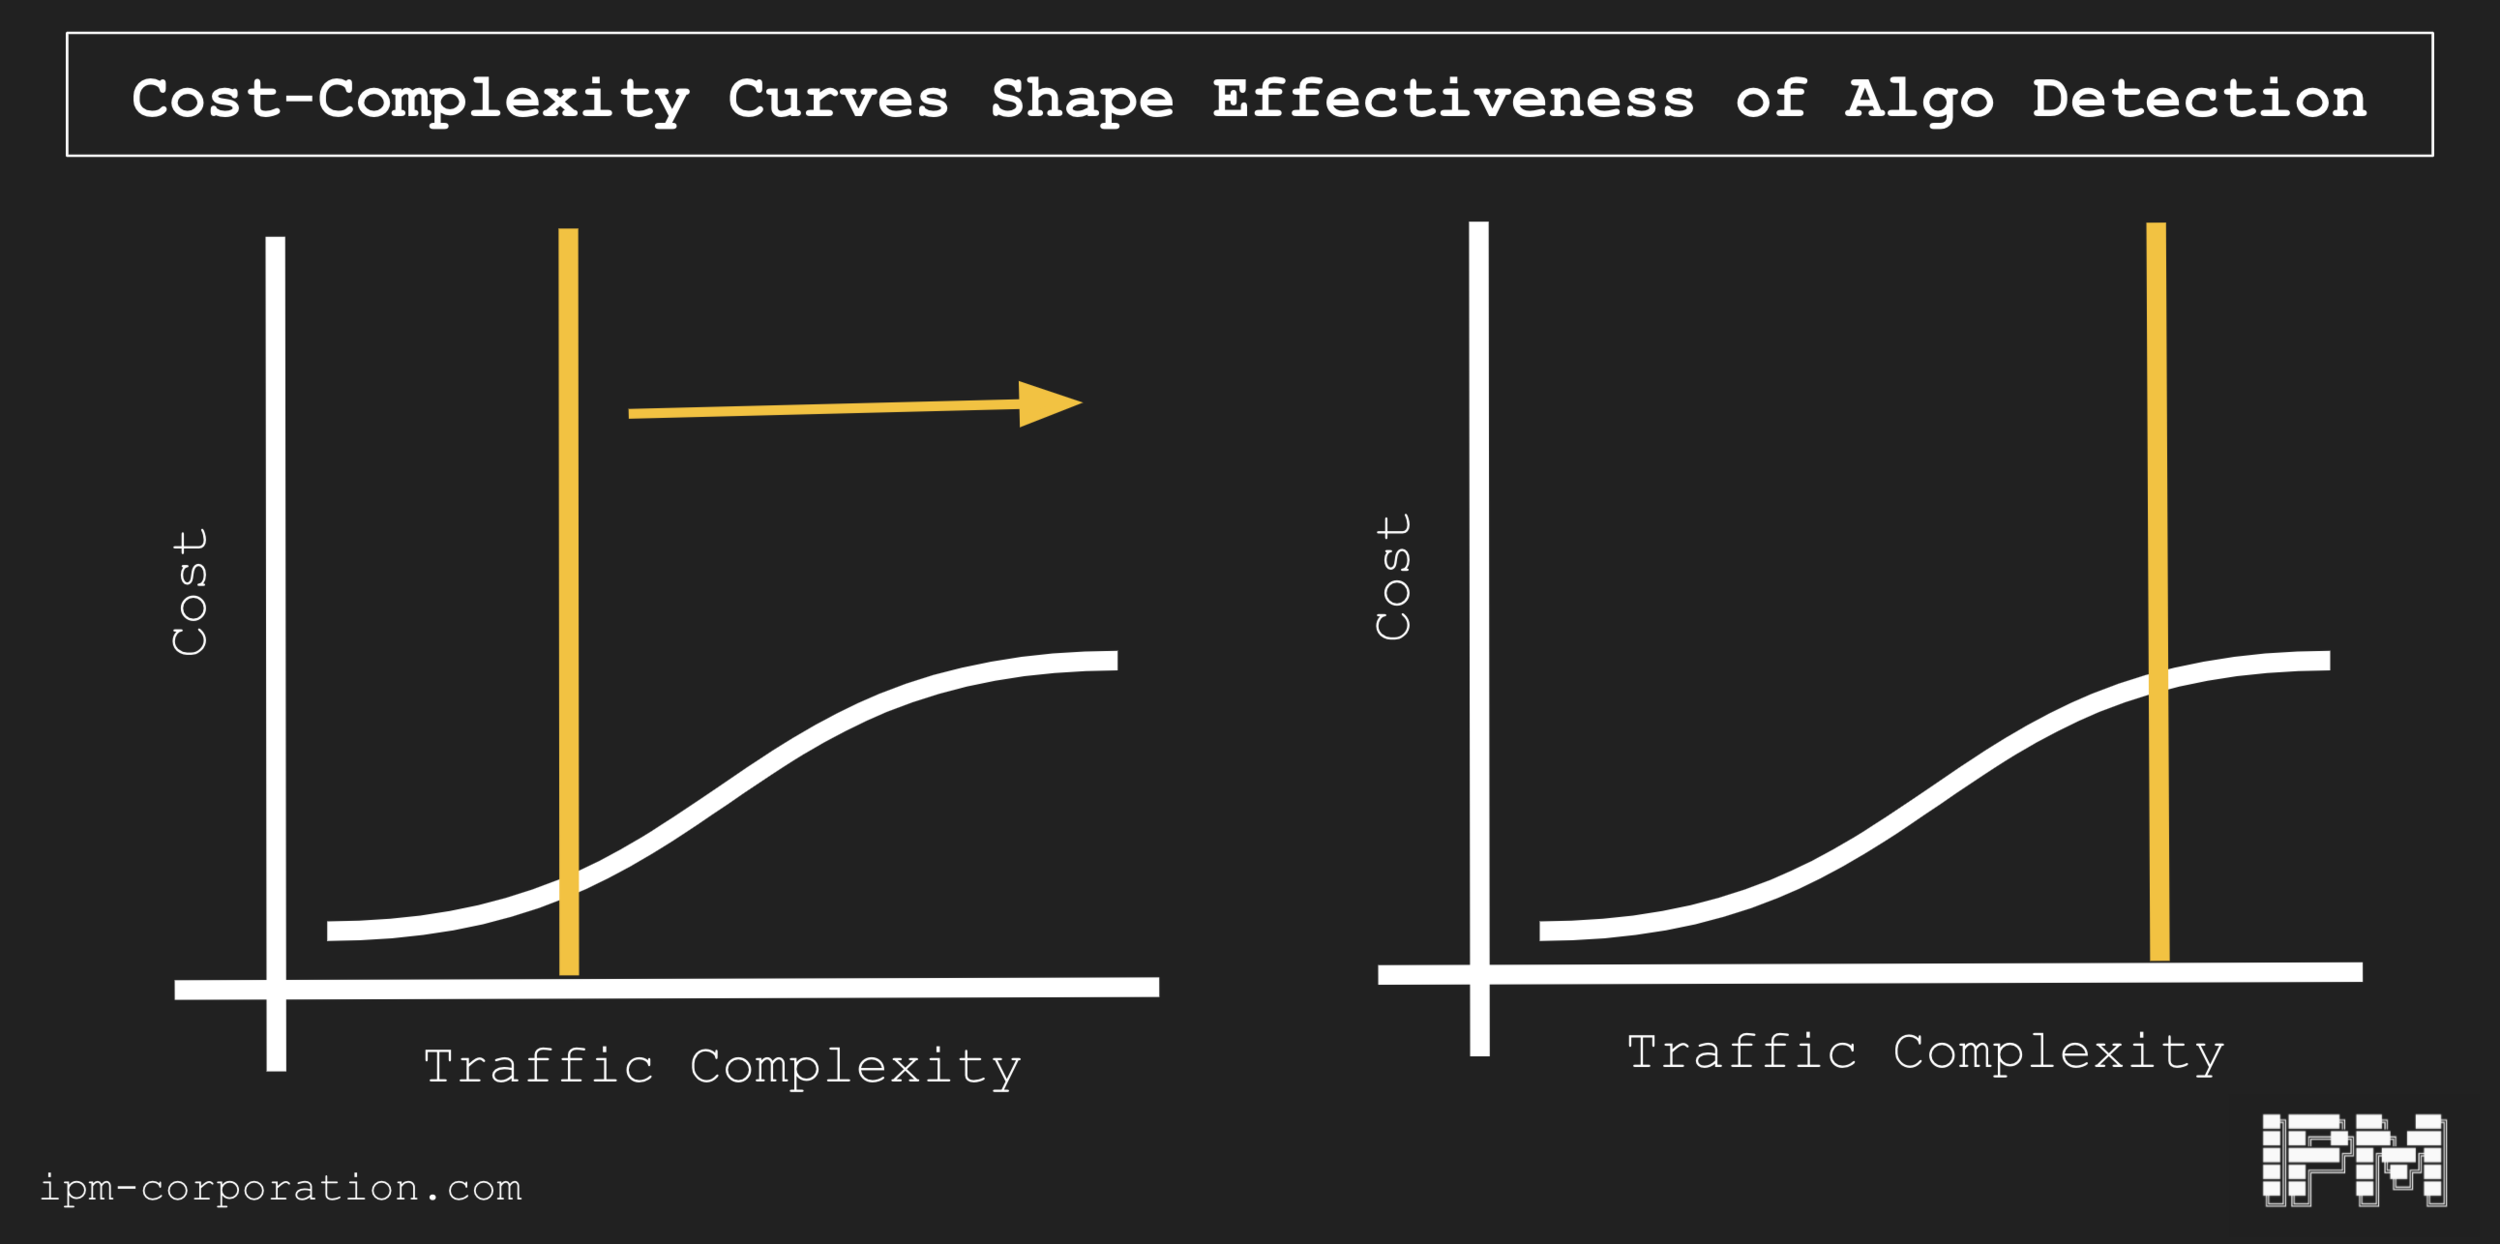
Nonlinear cost-complexity curve